
Research Review: Association Between Double-Leg Squat and Single-Leg Squat Performance and Injury Incidence Among Incoming NCAA Division I Athletes: A Prospective Cohort Study
By William Chancey Sumner, PTA, MS, CES, CAFS, HMS, FRCms, c-PT
Edited by Brent Brookbush, DPT, PT, COMT, MS, PES, CES, CSCS, ACSM H/FS
Original Citation: Eckard, T., Padua, D., Mauntel, T., Frank, B., Pietrosimone, L., Begalle, R., Goto, S., Clark, M., Kucera, K. (2018). Association between double-leg squat and single-leg squat performance and injury incidence among incoming NCAA Division I athletes: A prospective cohort study. Physical Therapy in Sport, 34, 192 – 200. ABSTRACT
Introduction:
Research has investigated several movement screens and assessments intended to highlight impairments that may result in injury, but most have shown little, if any efficacy (1-4). Research has demonstrated correlation between specific impairments and future injury risk (5 - 11); however, further research is needed to determine a practical and reliable assessment that will highlight those impairments. This 2018 prospective study by American researchers demonstrates that more identified movement faults (e.g. knee valgus, hip drop, forward lean) on the double-leg squat (DLS) and single-leg squat (SLS) tests were correlated with a greater incidence of lower extremity injury in collegiate athletes. Human movement professionals should consider integrating the DLS and SLS into practice, and addressing noted impairments with the intent of reducing the risk of future lower extremity injury.
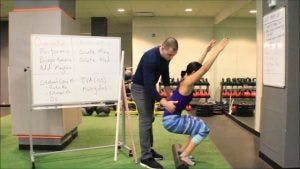
Overhead Squat Assessment (Image: courtesy of www.BrentBrookbush.com)
Study Summary
| Study Design | Prospective study |
| Level of Evidence | III Evidence from non-experimental descriptive studies, such as comparative studies, correlation studies and case-control studies |
| Participant Characteristics | Demographics
Inclusion Criteria:
Exclusion Criteria:
|
| Methodology |
|
| Data Collection and Analysis | Descriptive statistics were calculated for demographics, movement quality, and injury data.
Multi-variate Poisson regression analysis
Regression modeling was performed by SAS software (version 9.4; SAS Institute Inc, Cary, NC, USA) Receiver operating characteristic curve analysis was completed by SPSS Statistical software (version 24; IBM Corporation, Armonk, NY) |
| Outcome Measures |
|
| Results | Largest number of participants participated in men's football (29.6%, n=34), women’s soccer (17.4%, n=20) and men’s lacrosse (17.4%, n=20). 50 participants (43.9%) reported history of LE injuries. 110 LE (65.5%, n=72) injuries occurred during the study and the majority were acute in nature
Double-leg squat (DLS) test:
Single-leg squat (SLS) test:
16 subjects scored poor on both the DLS and SLS tests |
| Our Conclusions | The findings of this study show that more errors on the DLS and SLS may be associated with an increased risk of LE injury in collegiate athletes. The DLS and SLS should be considered for integration into a comprehensive movement assessment or athletic screen. Further research is needed to investigate interventions based on |
| Researchers' Conclusions | Collegiate athletes with more errors on the DLS or SLS demonstrated greater incidence of LE injuries than those with less errors. The majority of LE injuries in this study were acute and did not result in time lost from competition. |
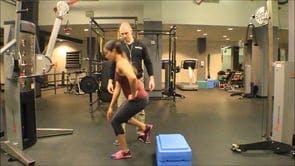
Hop Down to Single-Leg Landing and Balance (Image courtesy of www.BrentBrookbush.com)
How this study contributes to the body of research:
This study adds to a growing body of research investigating assessments with the intent of identifying impairments that may be predictive of future injury (1 - 3, 13 - 16). Previous research has demonstrated moderate to good inter- and intra-rater reliability using the double-leg squat (DLS ) and single-leg squat (SLS), but no data was available regarding the ability of the test to highlight impairments associated with increased risk. This prospective study addressed this gap, demonstrating that a lower score and/or certain movement discrepancies were correlated with higher risk in college athletes.
How the Findings Apply to Practice:
The findings of this study demonstrate a correlation between poor performance on the DLS /SLS and an increased risk of lower extremity (LE) injury. Human movement professionals should consider integration of the DLS /SLS into their assessment protocol, and potentially consider using these tests as a screen for preventative care programs. Future research should investigate the ability of interventions based on assessment findings, to reduce the risk of injury.
This study had many methodical strengths, including:
- Prospective studies are relatively rare in human movement science. This study demonstrated the efficacy of the DLS /SLS as screens for impairments that may increase the risk of injury.
- Multiple sports were included in data collection which aids in the studies generalizability to other college sports.
- Sex, BMI, LE injury history and sport cutting load were also analyzed as potential confounding variables. No correlation was noted.
Weaknesses and limitations that should be noted prior to clinical integration of the findings include:
- LE injury data was obtained from the university’s electronic medical record, which relies on self-reported injury to initiate treatment; this may have resulted in underestimated injury rates.
- All subjects were incoming NCAA Division I athletes; results may not be generalizable to recreational athletes and other populations.
- A small cohort was included in this study and a larger cohort may identify if the SLS or DLS scores are a significant indicator of LE injury risk.
How the study relates to Brookbush Institute Content?
The Brookbush Institute (BI) has developed predictive models of postural dysfunction based on evidence of common tissue changes (muscle, joint, fascia and nerve) to aid human movement professionals in selecting optimal assessments, manual interventions and exercise. This study uses the same assessments recommended by the BI, with the intent of identifying common tissue changes. The findings of this study demonstrate that the identification of movement impairments is predictive of future injury risk. The BI will continue to pursue optimal practice by refining predictive models of postural dysfunction , using aggregated results of all available evidence.
The following videos illustrate common assessment techniques for LED and assessment techniques:
Overhead Squat Assessment: Introduction
Overhead Squat Assessment: Feet Turn Out
Overhead Squat Assessment: Asymmetrical Weight Shift
Bibliography:
- Walbright, P., Walbright, N., Ojha, H., Davenport, T. (2017). Validity of functional screening tests to predict lost-time lower quarter injury in a cohort of female collegiate athletes. International Journal of Sports Physical Therapy, 12(6), 948-959
- Brumitt, J., Wilson, V., Ellis, N., Petersen, J., Zita, C., Reyes, J. (2018). Preseason lower extremity functional test scores are not associated with lower quadrant injury - a validation study with normative data on 395 Division III athletes. International Journal of Sports Physical Therapy, 13(3), 410-421
- McCunn, R., Ausder Funten, K., Fullagar, H., McKeown, I., Meyer, T. (2016). Reliability and association with injury of movement screens: a critical review. Sports Med, 46(6), 763-781
- Warren, M., Lininger, M., Chimera, N., Smith, C. (2018). Utility of FMS to understand injury incidence in sports: current perspectives. Open Access Journal of Sports Medicine, Sept 7, 9. 171-182
- Hewett, T. E., Myer, G. D., Ford, K. R., Heidt, R. S., Colosimo, A. J., McLean, S. G., & Succop, P. (2005). Biomechanical measures of neuromuscular control and valgus loading of the knee predict anterior cruciate ligament injury risk in female athletes A prospective study. The American journal of sports medicine, 33(4), 492-501.
- Ramskov, D., Barton, C., Nielsen, R. O., and Rasmussen, S. (2015). High Eccentric Hip Abduction Strength Reduces the Risk of Developing Patellofemoral Pain Among Novice Runners Initiating a Self-Structured Running Program: A 1-Year Observational Study. Journal of orthopaedic and sports physical therapy, 45(3), 153-161.
- Leetun, D., Ireland, M., Willson, J., Ballantyne, B., Davis, I. (2004). Core stability measures as risk factors for lower extremity injury in athletes. Medicine and Science in Sports and Exercise, 36(6), 926-934.
- Nadler, S. F., Malanga, G. A., Feinberg, J. H., Prybicien, M., Stitik, T. P., & DePrince, M. (2001). Relationship between hip muscle imbalance and occurrence of low back pain in collegiate athletes: a prospective study. American journal of physical medicine & rehabilitation, 80(8), 572-577.
- Zazulak, B. T., Hewett, T. E., Reeves, N. P., Goldberg, B., and Cholewicki, J. (2007). Deficits in neuromuscular control of the trunk predict knee injury risk. The American journal of sports medicine, 35(7), 1123-1130.
- Cholewicki, J., Silfies, S., Shah, R., Greene, H., Reeves, N. Alvi, K., Goldberg, B. (2005). Delayed trunk muscle reflex responses increase the risk of low back injuries. Spine. 30(23), 2614-2620.
- Lee, J., Hoshino, Y., Nakamura, K., Kariya, Y., Saita, K., Ito, K. (1999). Trunk muscle weakness as a risk factor for low back pain. Spine, 24(1), 54-57.
- Whittaker, J., Booysen, N., de la Motte, S., Dennett, L., Lewis, C., Wilson, D., McKay, C., Warner, M., Padua, D., Emery, C., Strokes, M. (2017). Predicting sport and occupational lower extremity injury risk through movement screening: a systematic review. British Journal of Sports Medicine, 51(7), 580-585
- Mokha, M., Sprague, P., Gatens, D. (2016). Predicting musculoskeletal injury in National Collegiate Athletic Association Division II athletes from asymmetries and individual-test versus composite Functional Movement Screen scores. Journal of Athletic Training, 51(4), 276-282
- Landis, J., Koch, G. (1977). The measurement of observer agreement for categorical data. Biometrics, 33(1), 159-174
- Stanley, L., Frank, B., Padua, D. (2016). Between-day reliability of lower extremity movement quality during double and single leg squatting tasks. Journal of Athletic Training, 51(6)
- Frank, B., Stanley, L., Padua, D. (2016). Inter-rater reliability of a lower extremity movement efficiency screening tool. Journal of Athletic Training, 51(6)
© 2018 Brent Brookbush
Questions, comments, and criticisms are welcomed and encouraged -